
- Search
- Riyadh26 ° C


Saudi real estate deals reach SAR 35.5B in July
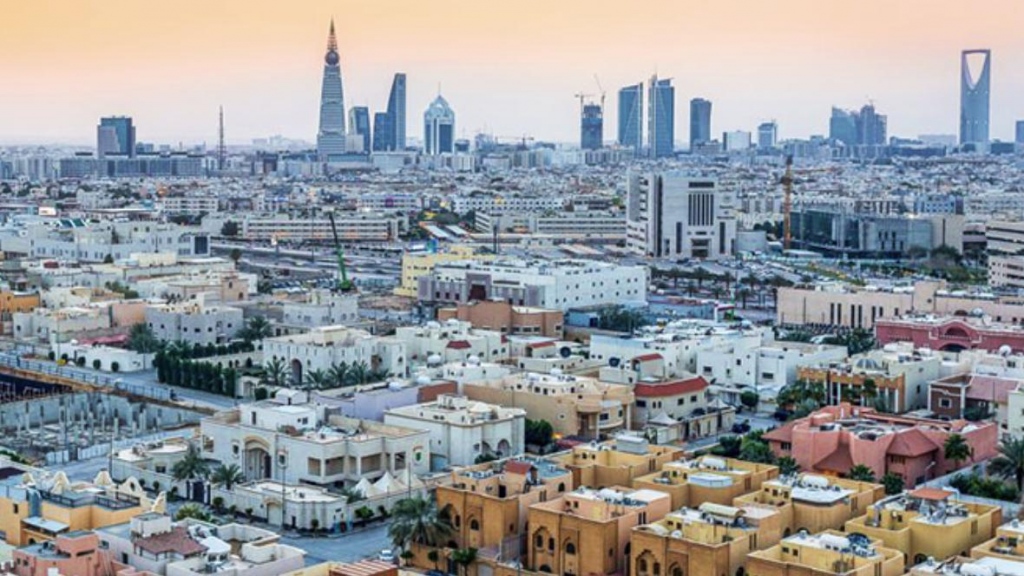
The value of real estate transactions in Saudi Arabia decreased by 32% in July 2026 to around SAR 35.5 billion from SAR 51.9 billion in the same month a year earlier.
This was driven by a 43% decline in the value of residential transactions to SAR 19.8 billion from around SAR 35 billion in July 2025, in addition to a 7% decline in the value of non-residential transactions to SAR 15.7 billion, according to data from the Real Estate General Authority (REGA).
Residential transactions accounted for approximately 55.8% of total real estate transaction value in July, while non-residential transactions represented around 44.2%.
| Transaction Value by Sector (SAR bln) | ||||
| Sector | July 2025 | July 2026 | Change | Percentage of Total |
| Residential | t | 19.82 | (43%) | 55.8% |
| Non-Residential | 16.88 | 15.72 | (7%) | 44.2% |
| Total | 51.93 | 35.54 | (32%) | 100.0% |
| Real Estate Transactions by Sector (SAR bln) | |||
| Month* | Residential | Non-residential | Total |
| January 2026 | 17.52 | 10.96 | 28.48 |
| February | 14.65 | 9.39 | 24.04 |
| March | 12.03 | 7.34 | 19.37 |
| April | 18.07 | 11.24 | 29.31 |
| May | 14.14 | 8.47 | 22.61 |
| June | 15.02 | 8.65 | 23.67 |
| July | 19.82 | 15.72 | 35.54 |
*Data is periodically updated.
The number of real estate transactions fell 15% YoY, with both residential and non-residential sectors declining 13% and 27%, respectively.
| No. of Transactions by Sector | |||
| Sector | July 2025 | July 2026 | Change |
| Residential | 26340 | 22837 | (13%) |
| Non-Residential | 3154 | 2314 | (27%) |
| Total | 29494 | 25151 | (15%) |
Land plots accounted for the largest share of residential transactions in July, with deals totaling SAR 9.82 billion, representing about 50% of the total value. Villas and apartments followed with SAR 3.52 billion and SAR 3.4 billion, respectively.
Residential transaction values varied across all property types year-on-year (YoY), with residential floors recording the strongest increase, rising 39% YoY.
| Residential Transaction Value by Property Type (SAR bln) | |||
| Type | July 2025 | July 2026 | Change |
| Land | 11.58 | 9.82 | (15%) |
| Apartment | 3.91 | 3.40 | (13%) |
| Villa | 3.63 | 3.52 | (3%) |
| Duplex | 1.09 | 0.98 | (10%) |
| Floor | 0.63 | 0.87 | 39% |
| Others | 14.21 | 1.21 | (91%) |
| Total | 35.04 | 19.82 | (43%) |
The data also showed a decline in residential real estate transactions across most property types in July compared with the same period a year earlier, except for villas and floors, which increased 24% and 41%, respectively.
| No. of Residential Transactions by Property Type | |||
| Type | July 2025 | July 2026 | Change |
| Land | 15279 | 12234 | (20%) |
| Apartment | 5890 | 5324 | (10%) |
| Villa | 1916 | 2382 | 24% |
| Floor | 696 | 981 | 41% |
| Duplex | 830 | 818 | (1%) |
| Others | 1729 | 1098 | (36%) |
| Total | 26340 | 22837 | (13%) |
REGA explained that liquidity was concentrated in major regions, with Riyadh accounting for 44% of total transaction value, followed by Makkah (28%) and the Eastern Province (12%). Together, the three regions accounted for 84% of total real estate transaction value.
| Top Administrative Regions by Transaction Value | ||
| Region | Value (SAR bln) | Share |
| Riyadh | 15.68 | 44.1% |
| Makkah | 10.09 | 28.4% |
| Eastern Province | 4.13 | 11.6% |
| Madinah | 2.84 | 8.0% |
| Qassim | 0.57 | 1.6% |
Riyadh also led in transaction volume, accounting for 31% of total deals executed across the Kingdom. It was followed by Makkah (21%) and the Eastern Province (15%).
Top Administrative Regions by No. of Transactions
| Region | Transactions | Share |
| Riyadh | 7670 | 31% |
| Makkah | 5279 | 21% |
| Eastern Province | 3722 | 15% |
| Qassim | 1967 | 8% |
| Madinah | 1254 | 5% |
Rental deal values jump 25% to SAR 10.6 billion in July, driven by residential sector
Rental transaction value increased 25% YoY to around SAR 10.6 billion in July, compared to SAR 8.5 billion a year earlier.
This was driven by a 28% increase in the value of residential lease transactions to around SAR 5.6 billion from SAR 4.4 billion in July 2025, accounting for 53% of total lease transactions.
| Rental Transaction Value by Sector (SAR bln) | |||
| Sector | July 2025 | July 2026 | Change |
| Residential | 4.37 | 5.59 | 28% |
| Non-Residential | 4.13 | 5.01 | 21% |
| Total | 8.50 | 10.60 | 25% |
Total rental deals rose 26% to 417,900 in July, up from nearly 331,200 in the year-earlier period.
Residential rentals increased 25%, compared to a 29% rise for the non-residential sector.
| No. of Rental Transactions by Sector | |||
| Sector | July 2025 | July 2026 | Change |
| Residential | 252059 | 315853 | 25% |
| Non-Residential | 79110 | 102069 | 29% |
| Total | 331169 | 417922 | 26% |
The number of rental contracts in Saudi Arabia rose 28% YoY in July 2026 to 356,000, driven by growth in both residential and non-residential leases.
Residential lease contracts increased 27% YoY to 284,000, while non-residential lease contracts grew 33% annually to 71,900.
| No. of Rental Contracts by Sector | |||
| Sector | July 2025 | July 2026 | Change |
| Residential | 223780 | 284044 | 27% |
| Non-Residential | 54069 | 71906 | 33% |
| Total | 277849 | 355950 | 28% |
Riyadh led the way among administrative regions by rental transaction value at SAR 4.43 billion, followed by Makkah (SAR 2.96 billion).
| Top Administrative Regions by Rental Transaction Value | ||
| Region | Value (SAR bln) | Share |
| Riyadh | 4.43 | 41.8% |
| Makkah | 2.96 | 28.0% |
| Eastern Province | 1.40 | 13.2% |
| Madinah | 0.59 | 5.6% |
| Aseer | 0.30 | 2.9% |
The Saudi capital also ranked first in rental transactions, recording 136,100 deals, representing 33% of total transactions across the Kingdom.
Makkah came second with 112,700 transactions (27%), followed by the Eastern Province with 65,900 transactions (16%).
| Top Administrative Regions by No. of Rental Transactions | ||
| Region | Transactions | Share |
| Riyadh | 136054 | 32.6% |
| Makkah | 112695 | 27.0% |
| Eastern Province | 65918 | 15.8% |
| Madinah | 26452 | 6.3% |
| Aseer | 17872 | 4.3% |


SMC signs SAR 148.5M contract for Riyadh hospital construction
Tuesday 29 September, 2026 8:00
STC Bank to Exclusively Activate Visa’s LALIGA partnership in Saudi Arabia
Tuesday 29 September, 2026 8:00
Egypt-Saudi electricity interconnection completed on Egypt side: Esmat
Tuesday 29 September, 2026 8:00
Saudi Arabia leads calls at UNGA to close USD1 trillion women’s health gap
Tuesday 29 September, 2026 8:00
Industry Ministry issues 364 licenses worth SAR 4.5B in June
Tuesday 29 September, 2026 8:00